
What is code coverage
Code coverage is a metric that verifies the extent to which code is safeguarded. It is pretty useful when implementing unit testing to ensure that your tests are covering the code conditions you really want to.
Code coverage is conventionally represented as a numerical percentage, wherein a lower value implies a diminished level of code protection.
Metrics used for code coverage
While lines of code serve as one metric for assessing code coverage, it is crucial to acknowledge that they are not the sole determinant of comprehensive code protection. Various units of measurement contribute to achieving well-rounded coverage, such as function coverage, statement coverage, branch coverage and condition coverage.
- Function coverage: Is a vital metric that quantifies the extent to which the defined functions are actually invoked or called during program execution. By measuring function coverage, developers can assess the effectiveness of their tests in exercising all the functions and identifying any potential gaps in code execution.
- Statement coverage: Is a fundamental metric used to evaluate the degree to which statements are executed during program run-time. It measures the proportion of statements that are traversed and executed by the test suite. By examining statement coverage, developers can gain insights into the thoroughness of their tests in terms of exploring different code paths and identifying any unexecuted or potentially problematic statements.
- Branch coverage: is a crucial metric that assesses the extent to which different branches of code bifurcations are executed by the test suite. It specifically measures whether all possible branches, such as those within if-else or if-elseif-else conditions, are exercised during program execution. By analyzing branch coverage, developers can determine whether their tests adequately explore various code paths, ensuring comprehensive validation of all possible branch outcomes. This helps identify potential gaps in testing and increases confidence in the reliability and robustness of the code.
- Condition coverage: Is a metric used to evaluate the adequacy of tests in terms of covering all possible outcomes of boolean sub-expressions. It measures whether different possibilities, such as true or false evaluations of conditions, are effectively tested. By assessing condition coverage, developers can ensure that all potential combinations and variations within boolean expressions are thoroughly examined, mitigating the risk of undetected issues related to specific condition outcomes.
Given the next code snippet:
pub fn add(x: usize, y: usize) -> usize {
    let mut z = 0;

    if x > 0 && y > 0 {
        z = x;
    }
    z
}- Function coverage will be achieved when the function
addis executed. - Statement coverage will be achieved when the function
addis called, such asadd(1, 1), ensuring that all the lines within the function are executed. - Branch coverage will be achieved when the function is called with
add(1, 0)andadd(1, 1), as the first call does not cover the if statement and line 5 remains unexecuted, while the second call enters the if statement. - Condition coverage will be achieved when the function is called with
add(1, 0),add(0, 1), andadd(1, 1), encompassing all possible conditions within the if statement.
LLVM-based coverage
In Rust 1.60.0, support for LLVM-based coverage instrumentalitation was stabilized un rustc.
It is called source-based because it operates on AST (Abstract syntax tree) and preporcessor information.
Code coverage relies on 3 basic steps:
- Compiling with coverage enabled: Enabling code coverage during compilation in clangd requires the inclusion of specific flags:
-fprofile-instr-generate and -fcoverage-mapping. - Running the instrumented program: When the instrumented program concludes its execution, it generates a raw profile file. The path for this file is determined by the
LLVM_PROFILE_FILEenvironment variable. If the variable is not defined, the file will be created as default.profraw in the program’s current directory. If the specified folder does not exist, it will be generated accordingly. The program replaces specific pattern strings with the corresponding values:- %p: Process ID.
- %h: Hostname of the machine.
- %t: The value of
TMPDIRenv variable. - %Nm: Instrumented binary signature. If N is not specified (run as
%m), it is assumed to be N=1. - %c: This string does not expand to any specific value but serves as a marker to indicate that execution is constantly synchronized. Consequently, if the program crashes, the coverage results will be retained.
- Creating coverage reports: Raw profiles files have to be indexed before generating coverage reports. This indexing process is performed by
llvm-profdata.
llvm-profdata merge -sparse foo.profraw -o foo.profdataGenerate code coverage in Rust
To generate coverage reports for our tests, we can follow the documentation provided by Rust and LLVM. The first step is to install the LLVM tools.
rustup component add llvm-tools-previewAfter installing the LLVM tools, we can proceed to generate the code coverage. It is highly recommended to delete any previous results to avoid potential issues. To do so, we need to execute the following sequence of commands:
# Remove possible existing coverages
cargo clean && mkdir -p coverage/ && rm -r coverage/*
CARGO_INCREMENTAL=0 RUSTFLAGS='-Cinstrument-coverage' LLVM_PROFILE_FILE='coverage/cargo-test-%p-%m.profraw' cargo test
This will execute the command cargo test and calculate all the coverage for the tests executed. This process will generate the *.profaw files that contain the coverage information.
Generate HTML reports
To visualize the coverage results more effectively, we can utilize the grcov tool, which generates HTML static pages. Installing grcov is straightforward and can be done using cargo.
cargo install grcov
Once grcov is installed, we can proceed to generate the HTML files that will display the coverage results.
grcov . --binary-path ./target/debug/deps/ -s . -t html --branch --ignore-not-existing --ignore '../*' --ignore "/*" -o target/coverage/- –binary-path: Set the path to the compiled binary that will be used.
- -s: Specify the root directory of the source files.
- -t: Set the desired output type. Options include:
- html for a HTML coverage report.
- coveralls for the Coveralls specific format.
- lcov for the lcov INFO format.
- covdir for the covdir recursive JSON format.
- coveralls+ for the Coveralls specific format with function information.
- ade for the ActiveData-ETL specific format.
- files to only return a list of files.
- markdown for human easy read.
- –branch: Enable parsing of branch coverage information.
- –ignore-not-existing: Ignore source files that cannot be found on the disk.
- –ignore: Ignore files or directories specified as globs.
- -o: Specifies the output path.
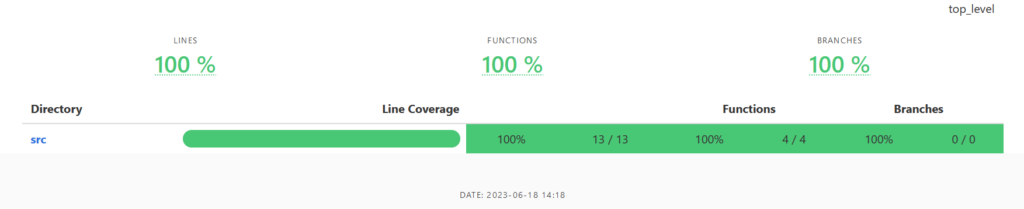
Upon successful execution of the aforementioned command, an index.html file will be generated inside the target/coverage/ directory. The resulting HTML file will provide a visual representation of the coverage report, presenting the coverage information in a structured and user-friendly manner.

Generate lcov files
Indeed, in addition to HTML reports, generating an lcov file can be beneficial for visualizing the coverage results with external tools like Visual Studio Code. To generate an lcov file using grcov, you can use the same command as before but replace the output type “html” with “lcov.” This will generate an lcov file that can be imported and viewed in various coverage analysis tools, providing a comprehensive overview of the code coverage in a standardized format.
grcov . --binary-path ./target/debug/deps/ -s . -t lcov --branch --ignore-not-existing --ignore '../*' --ignore "/*" -o target/coverage/lcov.infoFinally, we can install any extension to interpretate this information. In my case, I will use Coverage Gutters.

Finally, our vscode will look something like this. When we can see more visually and dynamic which lines of our code are being tested and the total percentage of the current file.
This is my script I recommend to use in order to generate the code coverage with HTML and LCOV files.
#!/bin/bash

# Define color variables
GREEN='\033[0;32m'
YELLOW='\033[1;33m'
NC='\033[0m'

function cleanup() {
  echo -e "${YELLOW}Cleaning up previous coverages...${NC}"
  cargo clean && mkdir -p coverage/ && rm -r coverage/*
  echo -e "${GREEN}Success: Crate cleaned successfully${NC}"
}

function run_tests() {
  echo -e "${YELLOW}Compiling and running tests with code coverage...${NC}"
  CARGO_INCREMENTAL=0 RUSTFLAGS='-Cinstrument-coverage' LLVM_PROFILE_FILE='coverage/cargo-test-%p-%m.profraw' cargo test --workspace
  if [[ $? -ne 0 ]]; then
    echo -e "${RED}Error: Tests failed to execute${NC}"
    exit 1
  fi
  echo -e "${GREEN}Success: All tests were executed correctly!${NC}"
}

function generate_coverage() {
  echo -e "${YELLOW}Generating code coverage...${NC}"
  grcov . --binary-path ./target/debug/deps/ -s . -t html --branch --ignore-not-existing --ignore '../*' --ignore "/*" -o target/coverage/ && \
  grcov . --binary-path ./target/debug/deps/ -s . -t lcov --branch --ignore-not-existing --ignore '../*' --ignore "/*" -o target/coverage/lcov.info
  if [[ $? -ne 0 ]]; then
    echo -e "${RED}Error: Failed to generate code coverage${NC}"
    exit 1
  fi
  echo -e "${GREEN}Success: Code coverage generated correctly!${NC}"
}

echo -e "${GREEN}========== Running test coverage ==========${NC}"
echo

cleanup

run_tests

generate_coverage
Using Tarpaulin
There is an existing powerful tool called Tarpaulin that can do all this for us. We can install it with cargo:
cargo install cargo-tarpaulinAnd finally, execute with a single command:
cargo tarpaulin
Jun 18 16:54:56.341  INFO cargo_tarpaulin::config: Creating config
Jun 18 16:54:56.433  INFO cargo_tarpaulin: Running Tarpaulin
Jun 18 16:54:56.433  INFO cargo_tarpaulin: Building project
Jun 18 16:54:56.433  INFO cargo_tarpaulin::cargo: Cleaning project
   Compiling rust_sandbox v0.1.0 (/home/imrubensi/rust_sandbox)
    Finished test [unoptimized + debuginfo] target(s) in 0.35s
Jun 18 16:54:56.907  INFO cargo_tarpaulin::process_handling::linux: Launching test
Jun 18 16:54:56.907  INFO cargo_tarpaulin::process_handling: running /home/imrubensi/rust_sandbox/target/debug/deps/rust_sandbox-0bab96c8aa79a774

running 1 test
test tests::it_works ... ok

test result: ok. 1 passed; 0 failed; 0 ignored; 0 measured; 0 filtered out; finished in 0.02s

Jun 18 16:54:57.137  INFO cargo_tarpaulin::report: Coverage Results:
|| Uncovered Lines:
|| Tested/Total Lines:
|| src/lib.rs: 4/4
||
100.00% coverage, 4/4 lines covered
Branch and condition coverage are the two main functionalities missed in this project. Apart from that, I do think that Tarpaulin is a good choice if you want to quickly assess your code coverage.